


The other day I was glancing through a list of players who have won the NBA’s Most Improved Player Award and it struck me that many of the winners were not able to sustain their success after their award-winning season.
In other words, these were just cases of players having fluke seasons, statistical anomalies in otherwise ordinary careers. That led me to the question that motivated today’s post: What were the biggest fluke seasons in NBA history?
I used a couple of formulas to help me along the way, but in the end this was much more art than science. When making the selections, I eliminated cases where an established star was having his peak season. For example, Tracy McGrady’s 2002-03 season stands out in his career line, but it’s hard to call it a fluke given that McGrady was a seven-time All-NBA selection.
Here are my choices for the seven biggest fluke seasons in NBA history, presented in chronological order. Please feel free to agree or disagree in the comments, and let me know if you feel I’ve missed someone.
Don May, 1970-71
In all of the profiles that follow, three figures will be presented for each statistic:
Average or total for all seasons before the given season.
Average or total for the given season.
Average or total for all seasons after that given season.
May’s statistics:
GP — 85 / 76 / 218
MPG — 9.4 / 35.1 / 14.5
PPG — 3.5 / 20.2 / 6.9
RPG — 2.0 / 7.5 / 2.6
APG — 0.6 / 2.0 / 0.9
FG% — 37.0 / 47.1 / 45.6
May, an All-America forward out of Dayton, had two nondescript seasons with the New York Knicks before he was selected in the NBA expansion draft by the Buffalo Braves in 1970.
May had a breakout season with the Braves, averaging 20.2 PPG, shooting 47.1% from the floor and 79.1% from the free throw line. All three of those figures placed him in the top 25 in the NBA that season.
Following the 1970-71 season, May was traded by the Braves to the Atlanta Hawks. May never came close to duplicating his 1970-71 campaign, and after just four more seasons he was out of the NBA.
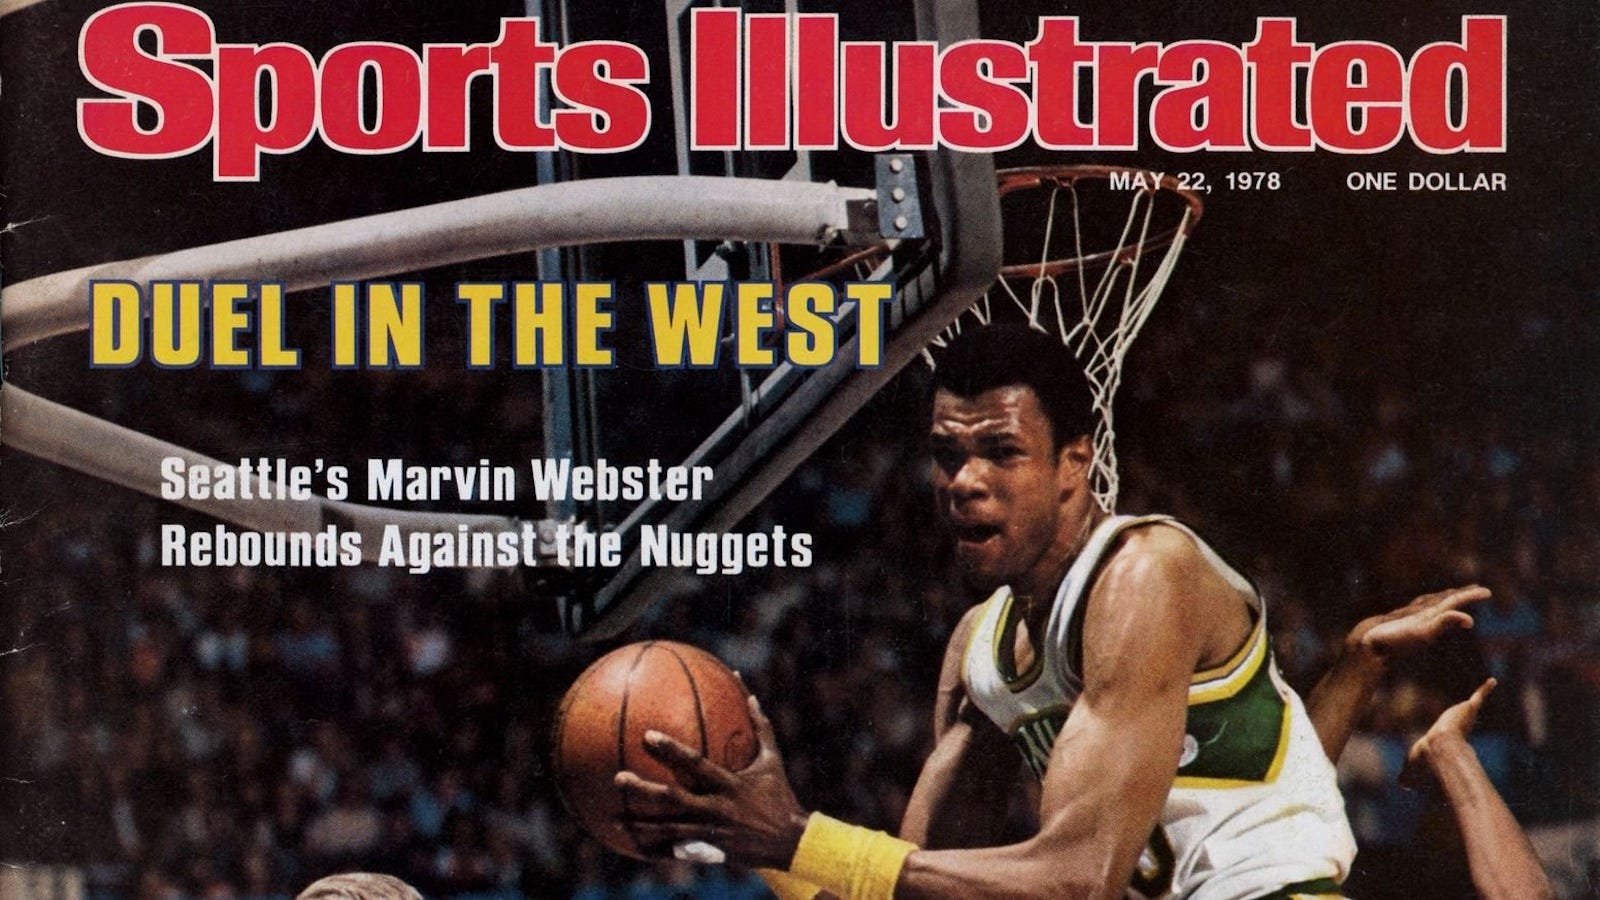
Marvin Webster, 1977-78
Webster’s statistics:
GP — 80 / 82 / 417
MPG — 16.0 / 35.5 / 21.1
PPG — 6.7 / 14.0 / 5.9
RPG — 6.1 / 12.6 / 6.1
APG — 0.8 / 2.5 / 1.1
BPG — 1.5 / 2.0 / 1.3
FG% — 49.5 / 50.2 / 48.2
Webster was a solid player in a limited role for the Denver Nuggets in 1976-77, but he truly emerged with the Seattle SuperSonics the following season.
Webster finished in the top 10 in the NBA in games played (third, tied), offensive rebounds (second), defensive rebounds (seventh), total rebounds (fifth), and blocks (seventh). He also received one first-place vote in the MVP Award voting.
In the postseason, Webster averaged 16.1 PPG, 13.1 RPG, and 2.6 BPG to help lead the Sonics to the NBA Finals, where they lost to the Washington Bullets in seven games.
In the offseason, Webster signed a five-year contract with the New York Knicks*, but due in part to illness and injury he never reached the heights he attained during the 1977-78 season.
* The Knicks apparently didn't learn their lesson from the Webster signing, as in 2005 they signed Jerome James — another Seattle center coming off a breakout playoff performance — to a ridiculous five-year, $30 million deal. As you can probably guess, that signing didn't work out either.
Don MacLean, 1993-94
MacLean’s statistics:
GP — 62 / 75 / 182
MPG — 10.9 / 33.2 / 19.3
PPG — 6.6 / 18.2 / 9.4
RPG — 2.0 / 6.2 / 3.4
APG — 0.6 / 2.1 / 1.1
FG% — 43.5 / 50.2 / 42.8
FT% — 81.1 / 82.4 / 71.1
MacLean was drafted in the first round of the 1992 NBA Draft by the Detroit Pistons, but before he played his first game he had already been traded twice: first on draft day (to the Los Angeles Clippers) and then about a month before the season started (to the Washington Bullets).
After an uninspiring rookie season, MacLean took a big step forward in 1993-94, tripling his playing time and increasing his offensive rating by about 13 points produced per 100 possessions. For his efforts, MacLean received the league's Most Improved Player Award.
MacLean’s career ended on a down note, as in 2000 he become the first NBA player suspended for using performance-enhancing drugs. The 2000-01 season ended up being the last of a disappointing career that had carried so much promise just seven years prior.
Dana Barros, 1994-95
Barros’ statistics:
GP — 372 / 82 / 396
MPG — 20.1 / 40.5 / 21.9
PPG — 9.2 / 20.6 / 9.5
RPG — 1.6 / 3.3 / 1.9
APG — 2.7 / 7.5 / 3.0
SPG — 0.8 / 1.8 / 0.7
FG% — 45.5 / 49.0 / 45.2
3P% — 39.8 / 46.4 / 40.4
FT% — 82.0 / 89.9 / 86.1
Barros set career highs in every category listed above, plus some others not listed, such as effective field goal percentage, true shooting percentage, assist percentage, and offensive rating.
Barros’ 12.7 win shares were good for sixth in the NBA, a total that led the Philadelphia 76ers by a whopping 9.1 win shares. Unfortunately for Barros, that was the only time in his career he finished a season in the top 75 in win shares.
Barros’ accomplishments did not go unnoticed, as he earned the only two major honors of his career in 1994-95: he was selected to play in the 1995 NBA All-Star Game and he won the league’s Most Improved Player Award.
Barros parlayed his big season into a six-year, $21 million free agent contract with his hometown team, the Boston Celtics, but he never again played at or near the level he reached during that magical 1994-95 season.
Brent Price, 1995-96
Price’s statistics:
GP — 133 / 81 / 204
MPG — 14.2 / 25.2 / 15.1
PPG — 5.0 / 10.0 / 4.9
RPG — 1.5 / 2.8 / 1.3
PPG — 2.8 / 5.1 / 2.2
FG% — 39.8 / 47.2 / 41.7
3P% — 29.3 / 46.2 / 37.8
FT% — 78.7 / 87.4 / 80.8
After missing the 1994-95 season due to a knee injury, Price came back with a career year in 1995-96. Playing for the Washington Bullets, Price became just the third player in NBA history to make at least 45 percent of his 3-point attempts while taking at least 300 shots from downtown (it’s been done 21 times by a total of 13 different players since).
Although he fell short of the minimum requirements for league leadership, Price’s career-best 60.2% effective field goal percentage was higher than that of the NBA’s leader, John Stockton (59.6%). Price also had the best free throw percentage of his career, the second-highest assist percentage, and the lowest turnover percentage, all contributing to an offensive rating of 124, a career high by about 13 points produced per 100 possessions.
Price signed a free agent deal with the Houston Rockets in the offseason, but he was never again the same player, thanks in part to various injuries (broken humerus, knee, back). Price ended his career with 12.0 win shares, with more than 60% of them coming in his surprising 1995-96 season (7.4).
Larry Hughes, 2004-05
Hughes’ statistics:
GP — 383 / 61 / 283
MPG — 29.8 / 38.7 / 30.4
PPG — 14.1 / 22.0 / 12.3
RPG — 4.4 / 6.3 / 3.4
APG — 3.1 / 4.7 / 2.9
SPG — 1.4 / 2.9 / 1.3
FG% — 41.1 / 43.0 / 39.0
Hughes had a decent season in 2003-04, but nothing to suggest the leap he made in 2004-05, when he led the NBA in steals per game and was an All-Defensive First Team selection.
An inefficient offensive player for most of his career, Hughes posted a career-high true shooting percentage of 52.3% in 2004-05. Hughes’ turnover percentage was 10.6%, the second-lowest figure of his career, and his assist percentage was 21.9%, the second-highest figure of his career.
Hughes signed as a free agent with the Cleveland Cavaliers following his 2004-05 campaign, with the hope that he would be a second star to pair with the then-20-year-old LeBron James. That hope was left unfulfilled, as Hughes missed 46 games with a broken finger that required surgery during the 2005-06 season. After just two-and-a-half mostly-disappointing seasons in Cleveland, Hughes was traded to the Chicago Bulls.
Mike James, 2005-06
James’ statistics:
GP — 248 / 79 / 268
MPG — 23.8 / 37.0 / 20.7
PPG — 9.2 / 20.3 / 7.4
RPG — 2.4 / 3.3 / 1.7
APG — 3.5 / 5.8 / 2.8
FG% — 41.1 / 46.9 / 38.9
3P% — 35.6 / 44.2 / 36.9
FT% — 76.0 / 83.7 / 81.7
Heading into the 2005-06 season, James had been something of a basketball nomad, playing for five different teams in his first four seasons in the NBA. But he found a home — albeit a temporary one — with the Toronto Raptors in his fifth season.
After never shooting better than 38.6% from 3-point range over his first four seasons, James shot 44.2% on 382 3-point attempts in 2005-06, good for fourth in the NBA. James’ success from downtown led him to achieve career highs in effective field goal percentage, true shooting percentage, and offensive rating.
Following the season, James’ peripatetic ways continued, as he signed as a free agent with the Minnesota Timberwolves. James did not last long in Minnesota, as within a year he was traded to the Houston Rockets. All told, James played for 11 different NBA franchises, two shy of the record held by Ish Smith (13).
I don’t have any disagreements or anything. I love this stuff, though. Great post. Thanks!
I'll never forget Antoine Carr's 1990-91 season for the Kings. He shot lights out that year. Twenty points a game! Otherwise, very average. Was Lionel Simmons on the shelf that season? 😳 Check it out!