


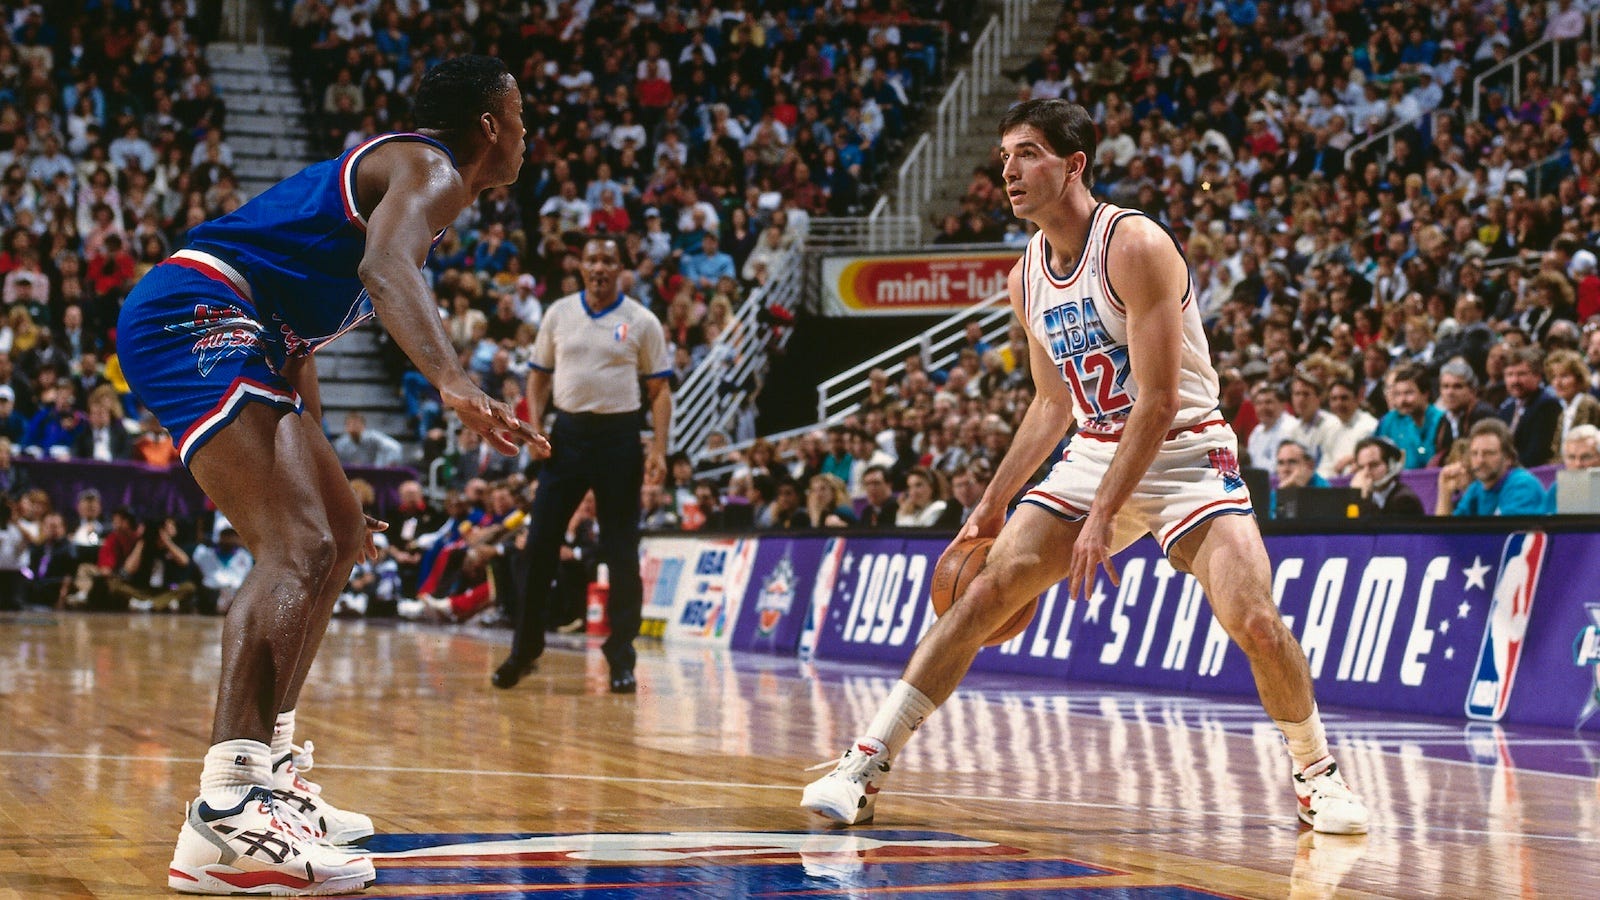
I just finished rereading Jack McCallum’s entertaining book Dream Team, the story of how the 1992 U.S. Olympic Men’s Basketball team was assembled and then proceeded to destroy its competition in Barcelona.
Those of you who were alive at the time will no doubt remember the biggest controversy when the team was announced: John Stockton over Isiah Thomas. I don’t want to rehash that debate here — McCallum has lots of inside information about what transpired in his book — but I would like to take a look back at these two players, pit them head-to-head to see who comes out on top in a comparison of their careers.
I. Awards and Honors
Let’s take a look at the qualitative information first:
Both players are members of the Basketball Hall of Fame.
Stockton was an 11-time All-NBA selection (two First Team, six Second Team, and three Third Team) while Thomas received five All-NBA nods (three First Team and two Second Team). I should note that the All-NBA Third Team was not added until 1989-90, when Thomas was in his eighth season. However, all five of Thomas’ All-NBA selections occurred in his first seven seasons, and I don’t think he would have been a Third Team choice in either of his two other seasons had it existed.
Stockton was selected to five All-Defensive teams, all of them Second Team nods. Thomas was never named to an All-Defensive team.
Stockton received MVP votes in 12 different seasons, Thomas in 10. Each player received just a single first-place vote, Stockton in 1994-95 and Thomas in 1983-84.
Thomas was named to 12 All-Star teams, Stockton 10.
Thomas was named All-Star MVP two times, Stockton once (co-MVP with teammate Karl Malone).
Thomas played in three NBA Finals — winning two titles — and was named Finals MVP in 1990. Stockton appeared in two NBA Finals, losing both times to the Chicago Bulls.
In my opinion the qualitative evidence comes out on the side of Stockton, but it’s close.
Verdict: Small edge, Stockton.
Now let’s dig a little deeper and see what stories the numbers have to tell us.
II. Offense
There are many things a player can do on offense to help his team, but the five most important skills are probably the following:
Make shots from the field.
Get to — and make shots from — the free throw line.
Minimize turnovers.
Create shots for others.
Extend possessions with offensive rebounds.
Let’s compare and contrast Stockton and Thomas in these categories.
Make shots from the field
Stockton was one of the more efficient shooters in league history: his career effective field goal percentage of .546 is good for 25th all time among players with at least 10,000 career points.
Thomas was nowhere near as efficient as Stockton, as his .465 career effective field goal percentage places him 305th on the same list.
Some will argue that Thomas shot at a much higher volume than Stockton did, making a direct comparison of their effective fields goal percentages a bit unfair.
The first part of that is true: Thomas did take a lot more shots from the field. Over his career, he averaged almost 60 percent more attempts per 36 minutes than Stockton (16.1 for Thomas, 10.3 for Stockton).
And that led to Thomas scoring more points from the field, as he averaged 15.0 points per 36 minutes from field goals while Stockton’s corresponding average was 11.2 points.
But think about it this way: In order to score 3.8 more points per 36 minutes, Thomas had to take 5.8 more shots per 36 minutes. That translates to an effective field goal percentage of .328.
I have no way of definitively proving this, but I find it almost impossible to believe that Stockton’s effective field goal percentage would have even dropped below .500 had he been forced to shoot as much as Thomas.
In fact, in the 70 regular season games in which Stockton attempted 16 or more field goals, his effective goal percentage was .526. That’s a bit lower than his career mark, but still well above Thomas’ career figure of .465.
Verdict: Big edge, Stockton.
Get to — and make shots from — the free throw line
As noted above, Thomas took more shots from the field, so as one might expect he took more shots from the free throw line: 5.4 attempts per 36 minutes as opposed to 4.4 for Stockton.
But Stockton was more efficient from the charity stripe — a career free throw percentage of .826 compared to .759 for Thomas — so Thomas’ edge at the line comes out to about half a point per 36 minutes.
If we look at free throw attempts relative to field goal attempts, we find that Stockton actually comes out well ahead of Thomas: 42.4 free throw attempts per 100 field goal attempts for Stockton, an advantage of about nine attempts over Thomas (33.4).
Verdict: Push.
Minimize turnovers
Stockton averaged 20.8 turnovers per 100 plays*, while Thomas was much better in this regard, averaging about four fewer turnovers per 100 plays.
* A play is defined to be a sequence that ends with the player (a) attempting a shot from the field, (b) taking two (or three) shots from the free throw line, or (c) turning it over.
But this doesn’t take into account the numerous sequences that ended with an assist, sequences where both players presumably possessed the ball for a relatively long time.
If we look at turnovers per 100 individual possessions*, Stockton’s average of 20.7 is about the same as his average per 100 plays, but Thomas’ rate of 19.0 is much higher than his rate per play.
* The formula for individual possessions was developed by Dean Oliver. It takes into account most offensive statistics that can be found in the box score.
Regardless, I would score this category as a win for Thomas.
Verdict: Edge, Thomas.
Create shots for others
Thomas assisted on approximately 37.4% of his teammates’ field goals while he was on the floor, good for 15th place among players with at least 15,000 career minutes played.
But when it comes to assists, Stockton is in a league of his own. Stockton registered an assist on a little over one-half of his teammates’ field goals while he was on the floor (50.2%), making him the career leader by more than five percentage points over Chris Paul (45.0%).
Verdict: Big edge, Stockton.
Extend possessions with offensive rebounds
Neither player was a gifted offensive rebounder — Thomas’ career offensive rebound percentage was 2.9%, Stockton’s was 2.5% — so there’s really nothing that needs to be said here.
Verdict: Small edge, Thomas.
III. Defense
What about defense? That can be harder to measure, of course, but let’s take a look at the evidence we do have, namely:
Team Defense
Defensive Rebounding
Steals
Blocks
Personal Fouls
As in the section above, let’s compare and contrast Stockton and Thomas in these categories.
Team Defense
Thomas played for five teams that finished in the top five in points allowed per 100 possessions, although none of those teams led the NBA. He was on a top-10 defense in just over one-half of his seasons (seven out of 13).
Stockton played for six teams that finished in the top five in points allowed per 100 possessions, and four of those teams finished first in the league. He was on a top-10 defense in just over two-thirds of his seasons (13 out of 19).
Verdict: Edge, Stockton.
Defensive Rebounding
There’s not much to say here, as this was not a strength for either player: Thomas’ career defensive rebound percentage was 7.8%, while Stockton’s was 7.5%. I don’t consider that a significant difference.
Verdict: Push.
Steals
Thomas finished his career with 1,861 steals, good for 18th place on the NBA’s all-time list. Expressed as a rate statistic, Thomas averaged 2.52 steals per 100 defensive possessions, placing him 58th on the all-time list (minimum 15,000 minutes played).
Once again, though, we find that Stockton is in a league of his own when it comes to this category. He finished his career with 3,265 steals, the all-time record by almost 600 steals over Jason Kidd.
Stockton was efficient, too — surprise, surprise — averaging 3.46 steals per 100 defensive possessions, good for seventh place on the career list.
Verdict: Big edge, Stockton.
Blocks
This is another category where neither player shined: Stockton averaged 0.46 blocks per 100 opponent 2-point attempts, while Thomas averaged 0.41.
Verdict: Push.
Personal Fouls
Stockton and Thomas both averaged 3.0 personal fouls per 36 minutes. Per 100 defensive possessions, those numbers are 4.2 for Stockton and 4.1 for Thomas.
Basically, neither player really helped their team by avoiding fouls, nor hurt their team with excessive fouling.
Verdict: Push.
IV. The Decision
With the caveat that I would not place equal weight on all categories (e.g., shooting efficiency is much more important than offensive rebounding), Stockton gets the edge in four statistical categories (three big, one small) and Thomas gets the edge in two categories (one small), with four pushes. I also gave Stockton a small edge when it comes to qualitative factors.
A few years ago, I developed the individualized wins* system for basketball. In simplest terms, it is an estimate of the number of wins contributed by a player through his offense and defense. Stockton is credited with 188 career indi wins (20th all time), while Thomas is credited with 97 (114th all time).
* This is my replacement for another statistic I created, win shares. Win shares, in my opinion, overrates low-usage/high-efficiency players and underrates high-usage/low-efficiency players. I’ll have to write up the details at some point.
“That’s nice,” you might say, “but Stockton played 525 more games and 12,248 more minutes in the regular season than Thomas did. Of course he has better career totals.”
That’s true, but Stockton averaged .189 indi wins per 48 minutes compared to .131 for Thomas. Even if we gave Thomas 12,248 additional minutes at his career rate, that only gets him to 130 indi wins, still well short of Stockton’s total.
I’m not convinced the gap between them is as big as indi wins suggests, but then again I have enough confidence in the system to say I absolutely believe Stockton did more to help his teams win regular season games than Thomas did.
Ah, but we’ve left out one key factor: postseason play. This is where Thomas makes up some ground.
Thomas consistently stepped up his game in the playoffs. In 111 career playoff games, he posted a rate of 0.171 indi wins per 48 minutes, an increase of more than 30% compared to the regular season.
In fact, his increase of 0.040 indi wins per 48 minutes from the regular season to the postseason is the largest in NBA history among players with at least 100 playoff games:
+0.040 — Isiah Thomas
+0.039 — John Salley
+0.031 — P.J. Tucker
+0.029 — Rajon Rondo
+0.025 — Anthony Johnson
+0.025 — Draymond Green
+0.021 — Rik Smits
+0.021 — Ben Wallace
+0.019 — Reggie Miller
+0.019 — Jerome Kersey
Stockton, on the other hand, consistently saw a slippage in play in the postseason. In 182 career playoff games, he averaged 0.141 indi wins per 48 minutes, a figure that’s about 25% less than his regular season rate.
As they say, banners hang forever, and Thomas’ stellar postseason play helped the Detroit Pistons raise two of them to the rafters (and very nearly three). Had Stockton maintained his regular season production in the postseason, the Utah Jazz may very well have one, if not two, championship banners hanging in Vivint Arena.
Final Verdict: I’m going with a split decision on this one. If I had to choose one player to have on my roster for the next 10 years, I would go with Stockton. If I had to choose one player for a postseason run, I would go with Thomas.
Stop it. I know, I know, everything is about numbers. And yeah, I get it. Im not, not a numbers guy. That said, if you watched Isiah and you also watched Stockton (who played with a guy who is third overall in points scored OF ALL TIME, you'd know the answer is Isiah. The guy willed teams to win. You always knew he was going to take over in the clutch, and he did. When you needed a basket, you knew he' get you one, and when you were the worst franchise in the league for 40 years and were starved for winning basketball let alone a championship, he raised two championship banners to the rafters along with an eastern conference banner and took us to two more eastern conference finals. Stockton was a steady, DAMN good, no really good basketball player. Isiah was the man.
For regular, season, Stockton is so far beyond Isiah it's not funny. Stockton > Isiah on proficiency, which is then multiplied by the difference in longevity as Stockton played 54% more career games. Overall, Stockton likely brought more than twice as much total value over the course of his career. No contest.
For playoffs, though, Stockton fell and Isiah is one of the few players who actually rose relative to his regular-season play. Even so, I'd say it's essentially a tie for proficiency, and Stockton has 64% more PO games played.