

Showdown: Tim Duncan vs. Kobe Bryant
The tale of the tape for two 21st century legends.

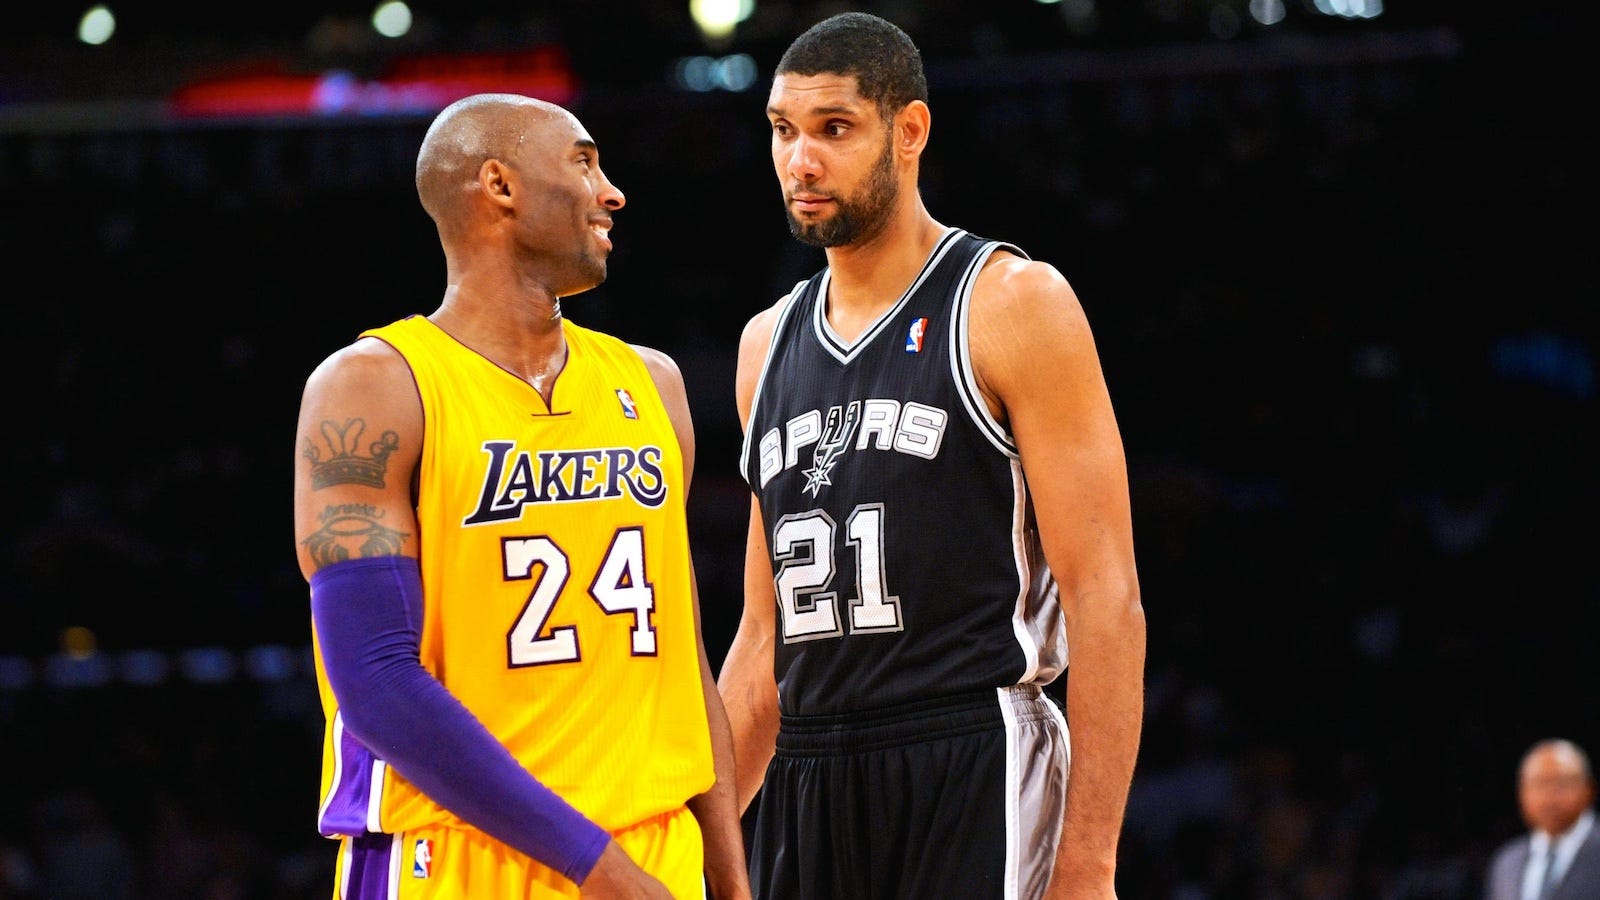
Tim Duncan and Kobe Bryant are two 21st century legends, each spending their entire career with a single franchise (Duncan with the San Antonio Spurs, Bryant with the Los Angeles Lakers). They faced off 51 times in the regular season, with Duncan holding a 31-21 edge. Bryant flipped the script in the postseason, though, claiming an 18-12 advantage (4-2 series edge). Whose career comes out on top when we pit them head-to-head?
I. Awards and Honors
Let’s take a look at the qualitative information first:
Both players are members of the Basketball Hall of Fame.
Bryant was named to 18 All-Star teams, Duncan to 15.
Both players were 15-time All-NBA selections. Bryant earned 11 First Team nods, two Second Team nods, and two Third Team nods, while Duncan received 10, three, and two, respectively.
Duncan was selected to 15 All-Defensive Teams (eight First Team and seven Second Team), while Bryant earned the honor 12 times (nine First Team and three Second Team).
Duncan received MVP votes in 16 different seasons, Bryant in 13. Duncan won the award twice compared to once for Bryant, and each player had five top-three finishes.
Although he never won the award, Duncan received Defensive Player of the Year consideration 15 times, including nine seasons in which he earned at least one first-place vote. Bryant appeared in the balloting 10 times, earning at least one first-place vote in four of them.
Bryant played in seven NBA Finals and Duncan appeared in six, with both players winning five titles. Duncan was named Finals MVP three times, an award Bryant received twice.
In my opinion, the qualitative evidence comes out on the side of Duncan, but it’s really close. Let’s dig a little deeper and see what stories the numbers have to tell us.
II. Offense
There are many things a player can do on offense to help his team, but the five most important skills are probably the following:
Make shots from the field.
Get to — and make shots from — the free throw line.
Minimize turnovers.
Create shots for others.
Extend possessions with offensive rebounds.
Let’s compare and contrast Duncan and Bryant in these categories.
Make shots from the field
Duncan’s career effective field goal percentage of 50.7% ranks 287th among the 921 players with at least 2,000 field goals made, while Bryant’s 48.2% places him 545th. That’s a difference of about 50 points per 1,000 shots, a significant discrepancy.
Verdict: Big edge, Duncan.
Get to — and make shots from — the free throw line
Duncan got to the free throw line slightly more often on a relative basis, averaging 41.6 tries per 100 field goal attempts compared compared to 38.2 for Bryant. However, Bryant shot a much better percentage from the charity stripe (83.7% versus 69.6%) and averaged one more attempt on a per-36-minute basis (7.4 to 6.4).
Verdict: Big edge, Bryant.
Minimize turnovers
Bryant averaged 13.8 turnovers per 100 individual possessions*, while Duncan’s corresponding rate was 14.1. Given that we’re dealing with estimates of individual possessions, I don’t think that’s a meaningful difference.
* The formula for individual possessions was developed by Dean Oliver. It takes into account most offensive statistics that can be found in the box score.
Verdict: Push.
Create shots for others
Bryant assisted on approximately 24.2% of his teammates’ made field goals while he was on the floor, a figure that’s almost 50% larger than Duncan’s assist rate of 16.4%.
Verdict: Big edge, Bryant.
Extend possessions with offensive rebounds
Duncan ranks 11th on the NBA’s all-time list for offensive rebounds with 3,859, placing in the top 10 in six seasons. He averaged an estimated 9.7 offensive rebounds per 100 opportunities, dwarfing Bryant’s career figure of 3.5. Of course, Bryant was a 6-foot-6-inch guard while Duncan was a 6-foot-11-inch forward/center, so this difference is to be expected.
Verdict: Big edge, Duncan.
Find out why Atlanta Hawks play-by-play man Bob Rathbun says Statitudes is “a valuable part of my daily research and it is FUN!” Sign up using the special link below and get 25% off your first 12 months.
III. Defense
What about defense? That can be harder to measure, of course, but let’s take a look at the evidence we do have, namely:
Team Defense
Defensive Rebounding
Steals
Blocks
Personal Fouls
As in the section above, let’s compare and contrast Duncan and Bryant in these categories.
Team Defense
We obviously can’t assign all of the credit to either player for the defensive success of their teams, but both played substantial minutes (34-36 per game) and therefore had an influence (good or bad) on that end of the floor.
The Spurs had a top-three defense (based on points allowed per 100 possessions) in 15 of Duncan’s 19 seasons, leading the NBA six times. And it wasn’t like the Spurs were slouches in the other seasons, ranking fifth, eighth, 10th, and 11th.
On the other hand, only one of Bryant’s teams fielded a top-three defense (the 1999-00 Lakers, who ranked first). Eleven of Bryant’s teams finished with a lower placement than Duncan’s career-worst rank of 11th.
Verdict: Big edge, Duncan.
Defensive Rebounding
Duncan was an excellent defensive rebounder, averaging 26.5 defensive boards per 100 opportunities. Bryant was a very good rebounder relative to his position, with a career defensive board percentage of 12.6%. Still, this one unsurprisingly goes to Duncan.
Verdict: Big edge, Duncan.
Steals
Bryant averaged an estimated 2.07 steals per 100 opponent possessions, while Duncan’s corresponding rate was 1.14. Over a typical season, that’s an advantage of almost 50 steals for Bryant, a huge difference.
Verdict: Big edge, Bryant.
Blocks
Duncan blocked about 4.58 shots per 100 opponent 2-point attempts, a rate that’s almost quintuple Bryant’s figure of 0.96. Calling this a significant difference is an understatement, although once again unsurprising given the size disparity.
Verdict: Big edge, Duncan.
Personal Fouls
Duncan and Bryant both averaged about 2.5 personal fouls per 36 minutes. Per 100 defensive possessions, the rates are 3.7 personal fouls for Duncan and 3.6 for Bryant. Basically, neither player really helped their team by avoiding fouls, nor hurt their team with excessive fouling.
Verdict: Push.
Do you have family and friends who love the NBA as much as you do? Please consider sharing this publication with them. Your support is greatly appreciated.
IV. The Decision
With the caveat that I would not place equal weight on all categories (e.g., shooting efficiency is much more important than offensive rebounding), Duncan gets the edge in four categories (all big) while Bryant gets the edge in three categories (again, all big), with three pushes. I also gave Duncan a small edge when it came to qualitative factors.
It’s obviously close. One thing I haven’t looked at (other than championships won) is postseason performance. Duncan and Bryant are two of the 51 players in NBA history who have played at least 5,000 minutes in the playoffs. Duncan ranks fifth in that group with a postseason PER of 24.3, while Bryant places 14th with a career figure of 22.4.
How about the NBA Finals? In 37 contests, Bryant averaged 25.3 PPG, 5.7 RPG, and 5.1 APG, shooting 41.2% from the field and 84.8% from the free throw line. The Lakers won 23 of those games, a winning percentage of .622.
Duncan averaged 20.8 PPG, 13.3 RPG, and 2.4 BPG in 34 Finals games, with shooting percentages of 48.5% from the field and 71.6% from the free throw line. The Spurs also posted 23 wins, but did so in three fewer games (a .676 winning percentage).
Final Verdict: Duncan and Bryant are two players who achieved similar results in very different ways. But it seems no matter how I segment their performances — peak, career, regular season, postseason, NBA Finals — I always come out with Duncan ahead, even if the margin is small. In this heavyweight battle, I’m calling it a unanimous decision for Duncan.